Median Home Value in Nashville, TN
Introduction
For my research, I used a regression analysis to measure the impact of various independent variables on median home value, which will provide insight into what some potential drivers for gentrification in Nashville are. Median home value is a measure that has been used by a multitude of economists to observe and quantify changes in the visual and sociocultural landscape of aging housing in the United States. Some economists have even gone so far as to say that median home value is one of the only variables needed to truly track gentrification, and that by looking at median home value deviations of metropolitan tracts from the metropolitan median home value statistical average one can get a picture of large gentrification patterns throughout a city (Martin, R. W.). With that being said, there are a number of measures that can give insight into fluctuations in median home value and in turn further explain gentrification. These changes in median home value across urban neighborhoods in the United States are largely driven by capital investment, public policy, demographic changes in residents, and a number of other measures. There are various implications for this type of research, but I am most interested in answering one question, what affects median home value in Nashville, and to what degree? In answering this question, I am most curious in observing how certain characteristics of gentrification affect the price or value of a home.
In recent years, a wealth of academic research has been completed within the field of gentrification. Such research has provided a framework for the definition of gentrification both qualitatively and quantitatively. Gina Perez, an anthropologist currently teaching at Oberlin College, defined gentrification as “a gradual process whereby private capital (real estate firms, developers) and individual homeowners and renters reinvest in fiscally neglected neighborhoods through housing rehabilitation, loft conversions, and the construction of new housing stock. Unlike urban renewal, gentrification is a gradual process, occurring one building or block at a time, slowly reconfiguring the neighborhood landscape of consumption and residence by displacing poor and working class residents unable to afford to live in a ‘revitalized’ neighborhood with rising rents, property taxes, and new businesses catering to an upscale clientele” (Perez, Gina M). This definition has been largely accepted by the academic community as a holistic definition that captures a general snapshot of gentrification. Ruth Glass, a British sociologist who coined the term and pioneered research on gentrification in London, found that gentrification’s defining traits are an influx of capital and resultant displacement, and the transformation of local “social character” (Glass, R.). This definition has been helpful in identifying gentrification through quantitative measures, although recent studies have been quite creative in terms of the variables being used to define these changes, from yelp reviews to coffee shops, as measures. Additionally, Ms. Glass believed that the purpose of sociological research was to influence government policy and bring about social change.
While there are a large number of resources circulating within the field of gentrification, there is a great need to continue defining and researching this phenomenon on a micro scale, within individual cities, in order to address the unique characteristics of a metropolitan area through urban planning. Gentrification is a multifaceted issue that combines both supply side, demand side, and urban economic theories that explain this phenomenon, yet these theories have large variations depending on the city in question (Holland, S). A group of economists from Rice university, looked at gentrification occurring in Houston and used four quantitative measures to determine if areas were susceptible to gentrification (Neighborhood Gentrification). These measures were renter’s percentage households, percentage of low-income households, percentage of nonwhite residents, and percentage of residents without a bachelor’s degree. While the data they collected from these measures aided the research team in identifying gentrification susceptibility in their study, there are measures that may be more telling. For my analysis, I will conduct a linear regression to extrapolate what dictates changes in median home value across Nashville in order to better understand the context of gentrification.
Data
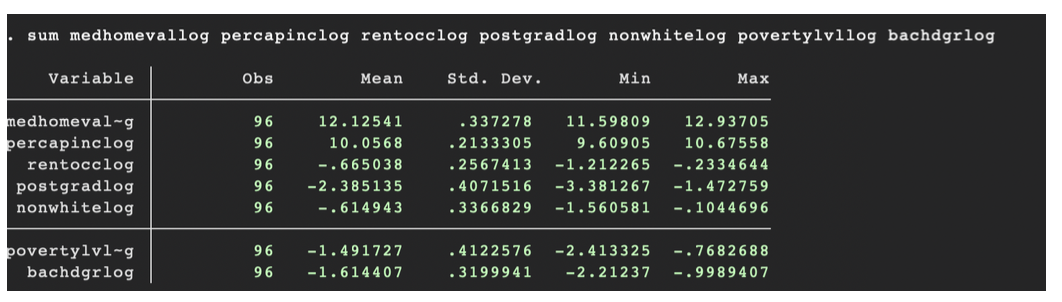
For this regression analysis, I used data collected by The Davidson County Chamber of Commerce. The Chamber supplied a number of economic measures, but I decided to focus on percentage of residents living below the poverty line (povertylvl), per capita income of residents (percapinc), percentage of renter occupied units (renterocc), percentage of non-white residents (nonwhite), percentage of residents with bachelor’s degrees (bachdgr) and percentage of residents with post graduate degrees(postgrad). I chose these variables based off of a study conducted at Rice University that observed changes in the value of housing stock to define stages of gentrification in Houston, Texas. The variables I observed span from 2011 to 2018 and the variables are representative of twelve different zip codes. I created a regression in which I analyzed how the six aforementioned dependent variables impacted median home value (medhomeval). The median home value variable was captured over the same years for the same zip codes. After selecting the variables, I decided to generate log variables in stata to look at elasticity. Additionally, since a number of the variables were percentages, this made my results easier to interpret. Below is the list of summary statistics for the aforementioned variables, the log variables summary statistics is included as well but it is far less intuitive.

There are 96 observations for each variable. Nashville’s Chamber of Commerce was able to supply information for each variable over the years 2011 through 2018. Ideally, to truly get a picture of what has impacted median home value over time, I would have liked to have had three decades worth of values, so over three times the number of observations. As you can see from the table above, the standard deviation of median home values across the 12 zip codes is $70, 489. Additionally, there is a $ 5, 275 standard deviation in per capita income.
Econometric or Forecasting Model
The model I chose to use to analyze this data is a linear regression model. A linear regression analysis will allow accurate identification as to the extent of the linear relationship between the independent variables and the dependent, or median home value. Additionally, I decided to use log variables within the regression analysis to look at percent changes instead of unit changes. I did so in order to normalize the data and also to make the results easier to interpret.
Results
For the first regression, I kept median home value as the dependent and entered the six independent variables. The R-squared for this model is .76, meaning the model is fairly robust and a large portion of the median home value is explained by the independent regressors in this model. According to the P-values, the percentage of renter occupied units, the percentage of residents with bachelor’s degrees, and the percentage of non-white residents, are all insignificant. On the other hand, per capita income, percentage of residents with post graduate degrees, and percentage of residents living below the poverty line, all had significant impacts on the dependent variable, median home value. After running this regression, I realized that a regression using log variables would be far more robust.

For my second regression, I used the log variables I had generated within Stata. The R- Squared value for this regression remained the same from the first, at .77. As for the P-Values, Per Capita Income (Log), Post Graduate Degree (Log) and Renter Occupied Units (Log) were significant, and the Percentage of Non-White Residents (Log), and Bachelor’s Degrees (Log), were insignificant. I decided to omit the variable Poverty Lvl, describing the percentage of residents living below the poverty level, because I felt that per capita income was a much more wholistic measure. The percentage of individuals living below the poverty level is a tricky variable because it does not account for individuals living slightly above the cut off. Per capita income gives a far better financial picture of the average resident within each specific zip code.

I will admit some of these results were not super intuitive. First, I was surprised that race did not play a role in impacting median home value in the same way it did in other cities I researched. In many other analysis of housing stock and gentrification, the percentage of minorities in a zip code has had significant impacts on the median home value. With that being said, when studying the history of Nashville, I found that the rising African American middle class ventured toward Jefferson Street around Fisk University when white flight was taking place across Nashville. Fisk was the black counterpart to the white Vanderbilt University, and it was at Fisk that music city gained its name as a result of the formation of the Fisk Jubilee singers in 1871 (Knight, M). The creation of various different African American founded institutions and minority owned businesses could be one explanation of these findings. Additionally, Nashville is a city that attracts a variety of types of people because of its creative spirit. A thriving minority community remains a key part of Nashville’s history and current culture. With this in mind, it seems that race does not play a role in home value on a zip code level. There are a number of reasons as to why this may be, but for the purposes of this research I have not further analyzed why.
Another finding, was the significance of the two education variables. The percentage of residents with a bachelor’s degree was insignificant but the percentage of residents with a post graduate degree was significant. In sum, residents having a bachelor’s degree does not describe median home value but post graduate degree concentration does. Furthermore, for every 1% increase in residents with postgraduate degrees there is a .3 % increase in the median home value. While this impact is small, the model found it to be significant and the finding does fall in line with that of other economists. I was surprised that bachelor’s degrees were not significant at all and that post graduate degrees had such a small impact on median home value. Intuitively, I would have assumed that both would have a larger impact, but higher education attainment is lower in southern cities versus northern and Nashville is a very creative city so perhaps it does make some sense that there is little correlation between higher education and home value.

On the other hand, per capita income did impact median home value the way I would have assumed. With every 1% increase in per capita income of the residents in a zip code, there is a 1.1% increase in the median home value. The more money that individuals within a certain zip code make on average, the more expensive the homes are. Additionally, the results for renter occupied units were consistent with my predictions, but in a way I didn’t expect. I assumed that the more units rented per zip code, the lower the median home value would be. This finding is consistent with many other American cities that are undergoing revitalization and gentrification. With that being said, I wouldn’t assume a city like New York to have the same results, because almost all residents rent apartments. In some cities, an excess of apartments has negative impacts on median home value because it makes the areas adjacent to apartments less desirable. As Nashville experiences bubbling growth, it makes sense that many young people are moving into posh apartments instead of homes which exhibits a change in housing preferences for young people. Today, a cluster of nice apartments often brings fancy coffee joints and juice bars which may drive up the value of the adjacent homes. Keeping this change in preferences in mind when viewing the regression analysis results, it does make sense that with an increase in the number of renter occupied units in a zip code, there is a marginal increase in median home value.
Conclusion
In sum, my goal was to analyze the impacts of six different variables on median home value. My final regression analyzed the impacts of five independent variables on a single dependent and I did so in terms of percent change. I was greatly surprised by some of the results at first, but when I gave the findings historical and cultural context, I was much more satisfied with my findings. My main takeaways were that per capita income, percent of renter occupied units, and percent of postgraduate degrees had the greatest impact on Nashville’s median home value. I believe that to truly make more concrete findings, I would need to gain access to a few more decades worth of data to have a larger number of observations and to eliminate certain factors I couldn’t account for in the regression such as natural disasters or economic downturns. For example, the Nashville flood had an impact on housing values across Nashville that were captured within this analysis. A decades worth of data would have helped me obtain more wholistic findings.
Sources
Glass, R. 1964, “Introduction,” London, Aspects of Change. London : Centre for Urban Studies: xiii--xxiii; xxiv-xxvl; xxx-xxxi. Via Brown-Saracino, J. (2013). The Gentrification
Debates: A Reader. London: Taylor and Francis.
Holland, S. (2016, January 1). Gentrification: Causes and Consequences. Retrieved from https://www.elca.org/JLE/Articles/1135
Knight, M. (2019, January 24). Retrieved from https://www.npr.org/podcasts/578326263/the- promise
Martin, R. W. (4AD). Gentrification Trends in the United States, 1970-2010 . Terry College of Business.
https://media.terry.uga.edu/socrates/contact/documents/2017/04/05/Determinants_of_Gentrification.pdf
Neighborhood Gentrification Across Harris County: 1990 - 2016. (n.d.). Retrieved April 28, 2020, from
https://www.arcgis.com/apps/Cascade/index.html?appid=bd4e77b646f6494ea1711bb381cf8fc5
Perez, Gina M. 2004. The Near Northwest Side Story: Migration, Displacement, and Puerto Rican Families. Berkley: University of California Press. Via Brown-Saracino, J. (2013).
The Gentrification Debates: A Reader. London: Taylor and Francis.